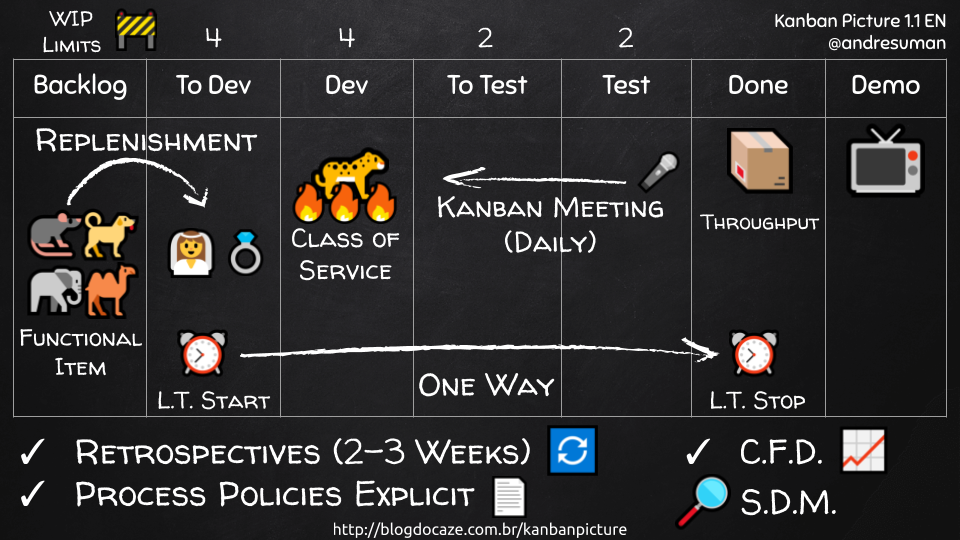
Kanban Picture
The Kanban Picture suggests a "work dynamic" for teams starting with the Kanban Method.
Andre Suman
What Is Kanban Picture?
A suggestion to explain and start with the Kanban Method.
Why Do Kanban Picture?
It's simple and it's a funny explanation.
How to do Kanban Picture?
Functional Item
“Between dogs and camels, all things are animals. You should avoid rats and Elephants” - Although there is variability in the size of the items, we avoid the extremes. A functional item generates value, each card on the board represents a delivery of value perceived by the business. if you want a dog, it’s leg, tail or head alone does not generate value.
Replenishment
Replenishment is the act of understanding and committing to demand. It is like a wedding - after the commitment point it is not desirable to give up the item (although it may happen ☹️ ). Kanban is a pull system - Frequent replenishment is more agile, on-demand replenishment is most agile!
Kanban Meeting
“Stop starting, start finishing!” iterates across the tickets from right (closest to completion) to left (most recently started). “Ask the cards, not the people” - What can we do to finish this job?
Done/Demo
At the end of the work, the team can demonstrate the result to the stakeholders. The team may decide to demonstrate on small batches of functionality of the same subject or on demand.
Retrospectives
Evaluate work output at regular intervals, analyze metrics and seek continuous improvement.
WIP Limit
Limit work in progress. These sample numbers represent the maximum number of functional items for workflow. Promote finishing and provoke important discussions. “Stop starting, start finishing!”
One Way
Do not move cards backwards. An item flows when work is completed at each step. If a correction needs to be made, keep the item in the same column, eventually signaling that a block exists. Focus on finishing.
Metrics
Throughput - The amount of items delivered in a given time frame, usually weeks. Lead Time - The clock starts ticking on replenishment and ends when the item is delivered.The number of calendar days to get an item done is the lead time. CFD - Cumulative Flow Diagram Shows demand, WIP, approximate average lead time and delivery rate capabilities. To collect these metrics you only need the start and finishing date for an item then count how many items you have per day in each column.
Explicit Policies
Post policies where you can see them. Policies are rules for how we work and should be developed collaboratively. Example - pull criteria, wip limits, date to deploy.
SDM
Service Delivery Manager is a suggested role to manage the flow. SDM manages blockers, collects metrics, and supports team for flow improvement.
Class of Service
Class of service is based on cost of delay and defines how this category of item is treated in the system. A “tiger on fire” (expedite) has higher priority than other animals (standard). The most common classes of services are standard, expedite, fixed-date and intangible.
Extra
Blocker/Block Column
Do not have a column for blocked items. A block is a condition for an item in some column of workflow, not a part of the workflow.
Look at Kanban Picture