Service Level Indicators
Quantify the quality of your service
Cansu Kavili
What Is Service Level Indicators?
Service Level Indicators, or SLIs, is about having meaningful measurements of your service in terms of your user's perspective. They are closely tied to what the users of the service care about, such as availability, latency, or response time.
Why Do Service Level Indicators?
In Site Reliability Engineering, there are three important practices: SLIs, SLOs and error budgets. The aim of these three things is to make better, informed decisions and prioritize our work based on the data we have. SLOs (Service Level Objectives) and error budgets give us the objective language and help drive the balance between reliability and the new feature prioritization. And SLIs are the most important part of it. Because to make the right decisions, we need meaningful SLIs.
How to do Service Level Indicators?
Since the software platforms are growing complex each day, unique components and data points are increasing as well. Having too many SLIs can be distracting and prevent focusing on what is important. You can run a session with the product owner, business owner, and the team to decide which measurements should be used as SLIs.
- Define what good or availability means to your users: Start with defining critical user journeys by asking questions like “How are your users interacting with the service?” or “What are they hoping to accomplish by using your service?“. This helps to define what good or availability means to the users.
- Map system components: Define the system boundaries within the platform or system-to-system interactions for each user journey. Which parts of your infrastructure do these journeys interact with? This helps to define the components that expose capabilities to the users.
- Define SLIs for each component: Define one or more SLIs for these components. Identify points in your service where you can measure them. These SLIs must reflect the user’s definition of good or availability. Note that it is important to have SLIs as measurements over a period of time, like an hourly window so that you can compare the service performance within a specified timeframe instead of a specific moment. One of the reasons for using SLIs is to enable continuous improvement, so being able to compare past, current and future performance is important. Use SLIs that utilize time metrics, such as "errors per day" or "average latency per hour" to enable comparisons.
- Determine data points: Decide how, where and what telemetry data/metrics to use and create implementation steps. Look for the points closest to the user, so that the data would be representative of their experience.
- Create a baseline: Start measuring to create a baseline. It is important to get baseline data as soon as you can so that you can start making informed decisions and measure progress, even if it might feel better to fix a few things first before enabling the measurements that it would look “better”.
- Observe and iterate: Observe your SLIs over a period of time (for example 1 or 2 weeks), track the correlation with user happiness, and iterate over them to get a better understanding of your service’s performance.
Here is an example:
The platform team decided to identify their first SLIs. First, the team lists the important user journeys.
Platform team’s users want to:
- Create sandbox environments on the platform
- Easily onboard new applications to the platform
- Know how their applications are doing on the platform
- Be notified when an issue affects their applications/users
- Debug live issues in case of a problem
- Access to logs and metrics in case of a problem
- Autoscaling the application under load
The team selects one of the most important user journeys: “Easily onboard new applications to the platform"
This journey is mapped for “using the self-service portal”. Users log in to the self-service portal and then complete the necessary information in order to get their application onto the platform.
User journey for this case:
- The user logs in to the portal by using their company credentials
- The user goes to the onboarding page
- The user fills the form with application information
From a user’s perspective “good” in this journey means:
- Portal is always available
- Portal authenticates the user when provided the right credentials
- Portal responds fast enough
The team maps out the system components for this journey would be:
- User can view the dashboard from the browser
- The browser displays the portal that running on the platform
- The portal can access to authentication API and validate user’s credentials
- The portal can access platform APIs to trigger onboarding flow
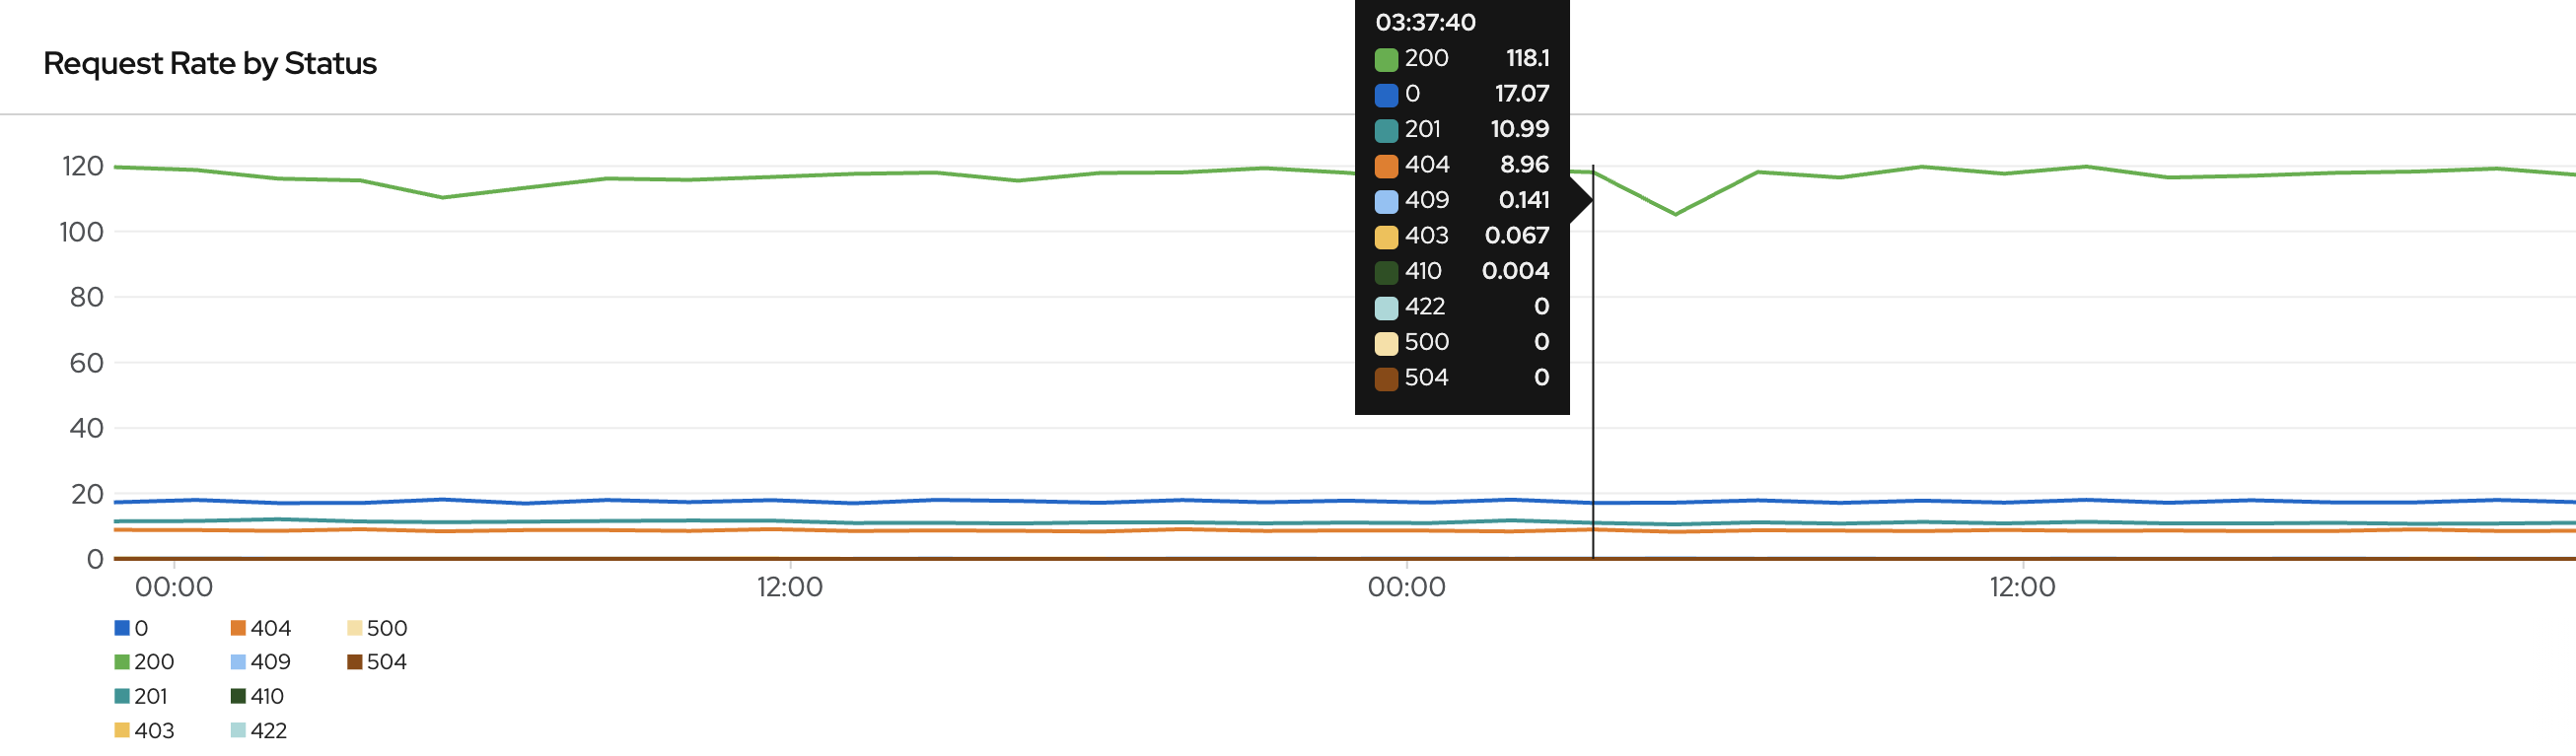
Then the team defines the SLIs as follow:
- Percentage of successful requests (ie status code is not 5xx)
- Requests that the portal responds to within 5 seconds.
Next is to decide the best place to collect data for the SLIs. It is important to select the point closest to the user. The team decides where to collect data and creates a dashboard to display that to reflect their service quality.
Look at Service Level Indicators
Links we love
Check out these great links which can help you dive a little deeper into running the Service Level Indicators practice with your team, customers or stakeholders.