System Diagram
A method for describing a system at the highest level possible
Rigel Di Scala
What Is System Diagram?
A system diagram is a simple and very high level description of a system that exists or needs to be built. It is a simple diagram that can be drawn collaboratively in little time. It can help a team get a clear, complete, and common understanding of a system.
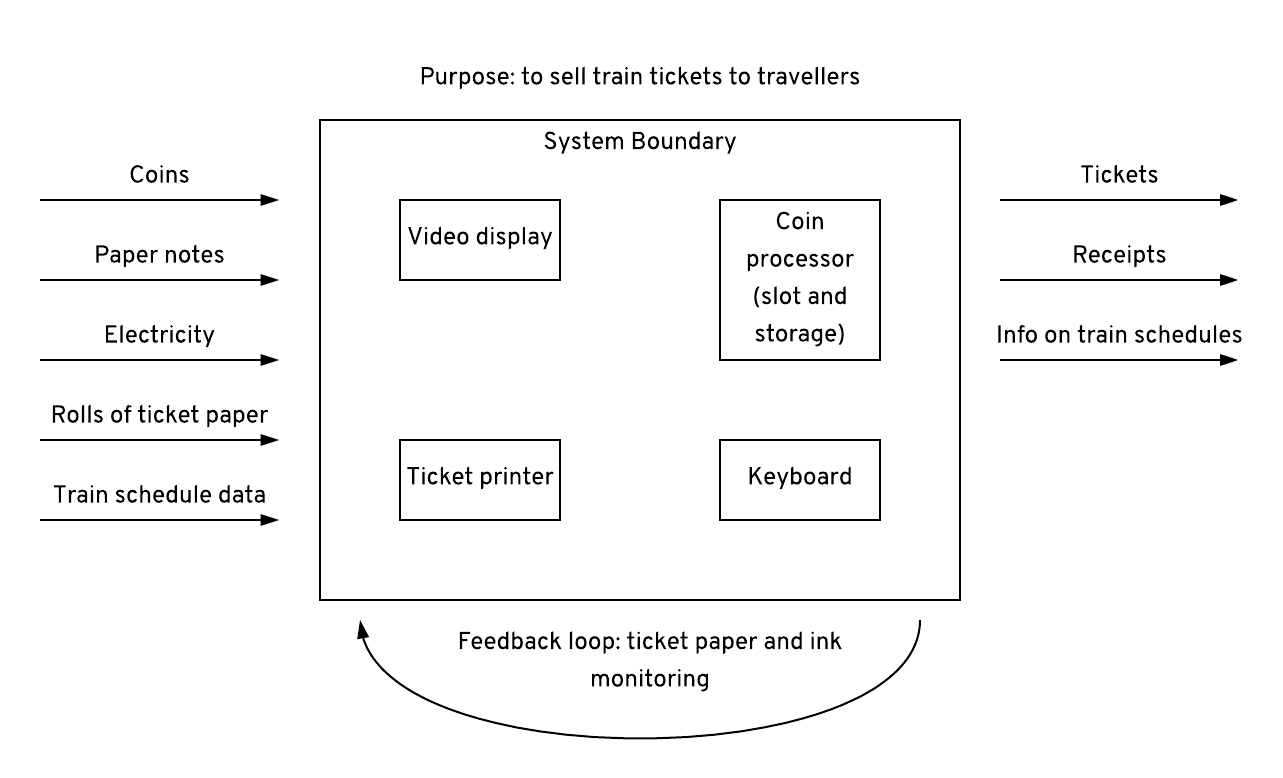
The components of a system diagram are:
- The Purpose
- The System Boundary
- One or more Inputs
- One or more Outputs
- One or more Subsystems
- One or more Feedback Loops

Why Do System Diagram?
The main enemy of system architects and software engineers is complexity. Complexity leads to a poor understanding of a system, which in turn can make the task of modifying or even using the system very challenging. The complexity of a system is reflected in its descriptions and documentation. The task of explaining a system to an audience of non technical people can be daunting. The System Diagram provides a simple method to solve this problem.
Identifying and describing all the components of a System Diagram should enable a team to get a good understanding of the system. If the diagram is too complex, perhaps it needs to be broken down into multiple integrated systems.
How to do System Diagram?
-
Gather the team around a blank whiteboard
-
Begin by drawing a large box in the middle of the canvas; this is your System Boundary
-
As a team, define the main Purpose of the system in one brief sentence and write it above the box
- If you struggle to define the Purpose in just one sentence, then the system might be too complex to describe, and you'll need to split it into multiple systems and diagrams
-
Define one or more Inputs that the system will receive from external actors
-
Define one or more Outputs that the system will provide to external actors
-
Define one or more Subsystems that are inside the Boundar; these typically process the inputs, but may perform other tasks as well
-
Define one or more Feedback loops that the system has in place to continously improve itself
Difficulty
- Facilitator: Moderate
- Participants: Easy
Facilitation Materials Needed
Digital Variation:
- any collaborative diagramming tool (such as Miro or Gliphy)
Physical Variation:
- a large whiteboard
- whiteboard markers
Look at System Diagram