Visualisation of Work
Visually represent all aspects of your team's work
Tim Beattie
Matt Takane
What Is Visualisation of Work?
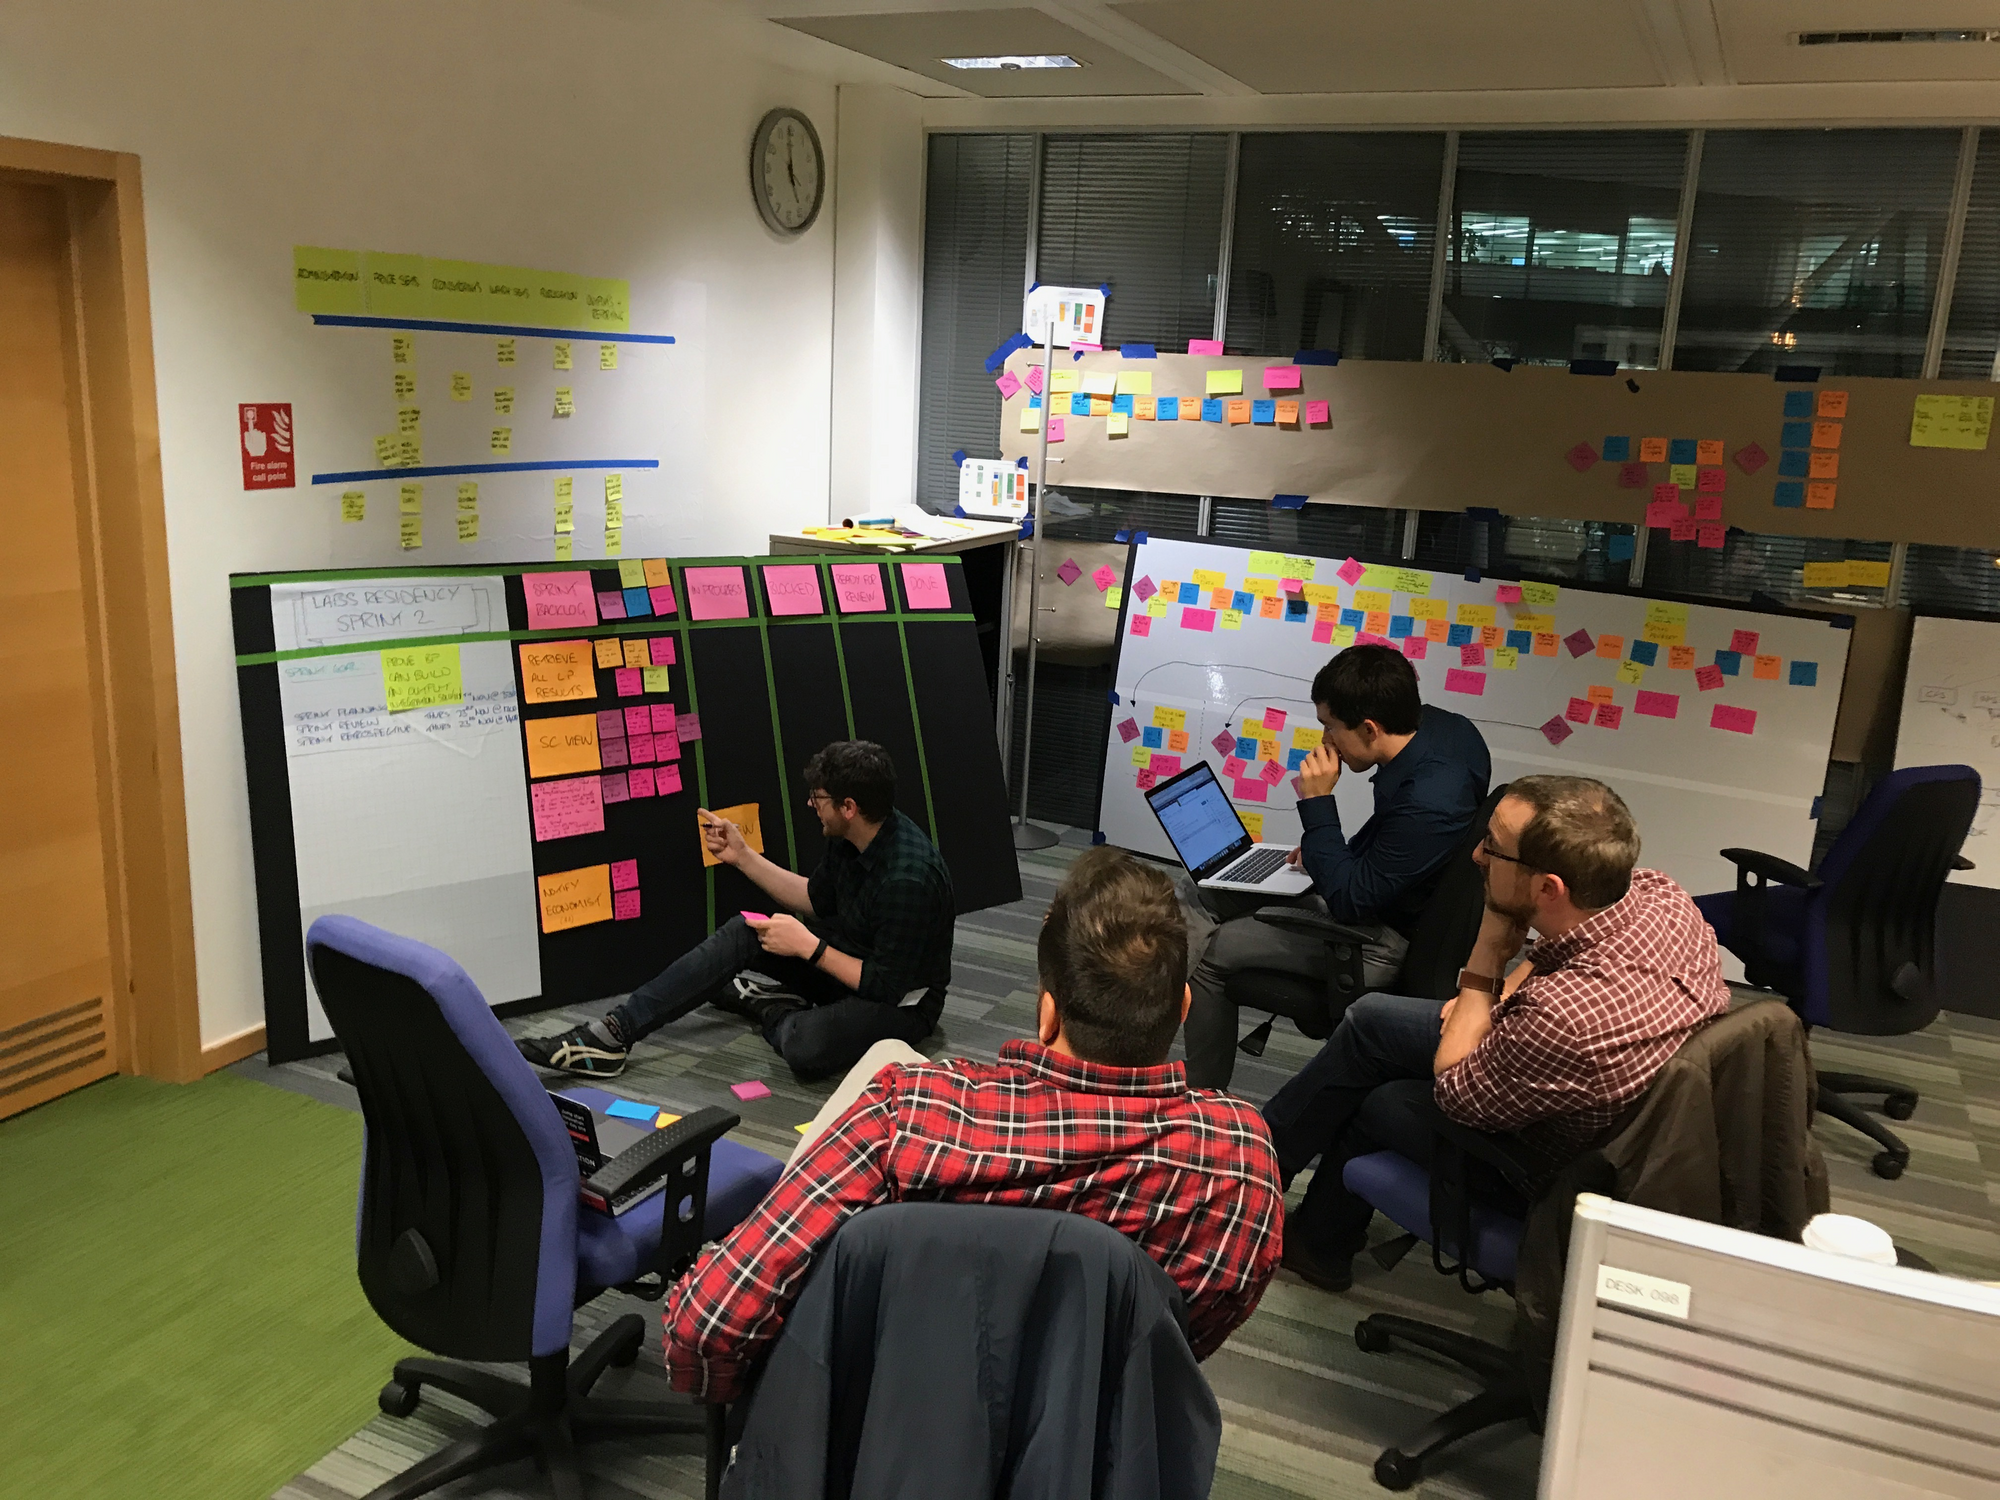
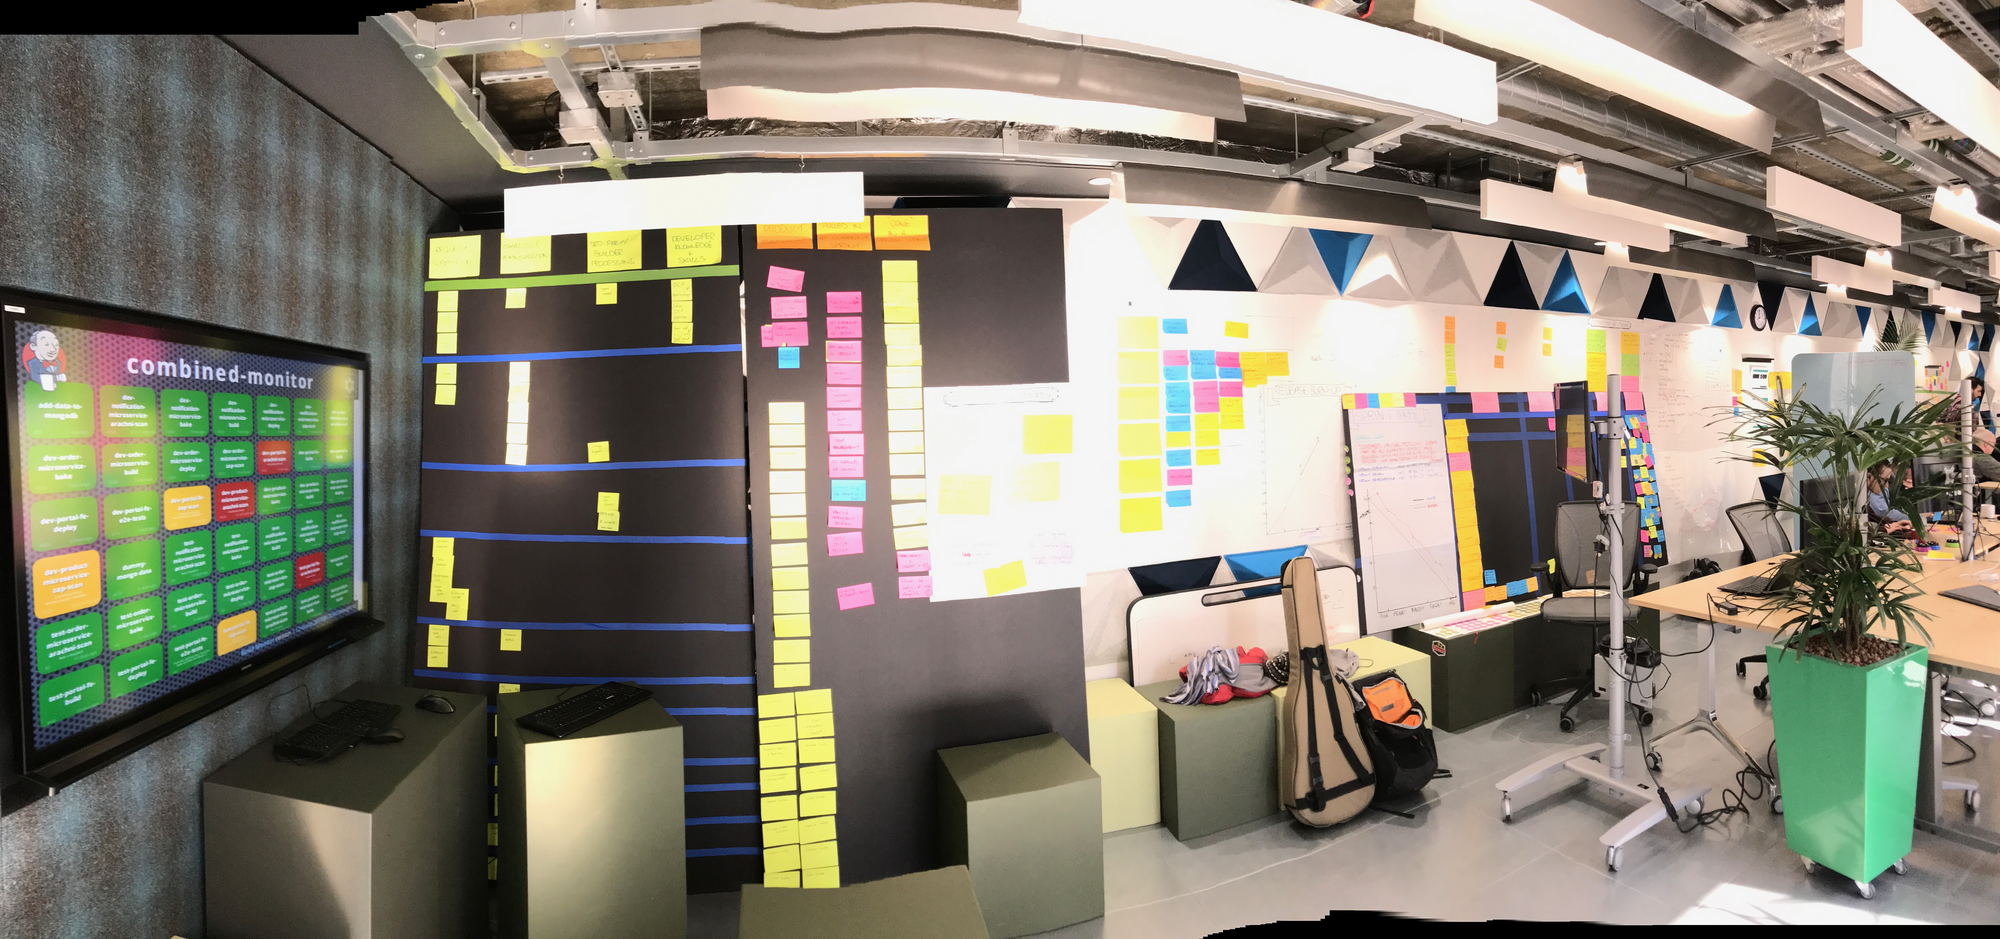
This practice involves radiating and visually representing all aspects of work. Information that is useful to team members, stakeholders and users is physically presented on walls, windows, doors and other flat surfaces and positioned in the line of sight of those people who will get value from consuming the information.
The "Information Radiator" is an artifact that is used to physically provide information to one or more people.
The activity of "Walking the Walls" is where someone interested in the work can walk around the physical space the associated team(s) are working from and get all the information they need from inspecting artefacts on the wall and from the resulting conversations.
Why Do Visualisation of Work?
Visualising work helps facilitate a transparent and open way of working. It helps avoid hiding information about status, progress, direction, challenges and opportunities related to a product. Traditionally such information is held in files on shared drives (for example, spreadsheets of project plans, powerpoint slides, word documents, etc.) which has the challenge of not being accessible or known about and, if found, not being up-to-date.
Where important information is constantly accessible and visible to people, both speed and accuracy of their work can improve with reduced wastage from having to search for information. It is also more likely that the information is accurate because people are continuously being reminded of it.
How to do Visualisation of Work?
Who do you need?
- A facilitator (such as a Scrum Master) to drive transparent ways of working.
- The full team who are responsible for delivering the work visualised.
- Interested stakeholders to consume information and feed back on it.
Suggested Time
- 5-10 minutes to produce each information radiator and start it radiating.
- Ad hoc updates performed on an ongoing basis with the facilitator driving the continuous consumption of and feedback from the information being presented.
Difficulty
- Facilitator - Medium
- Participants - Easy
How does it fit?
- Tyipcally done in the Culture and Collaboration are of the Foundation of the Open Practice Library
Facilitation Materials Needed
- Flip chart paper
- Magic Whiteboard charts
- Writable walls
- Flip chart and white board pens
- Stickie notes (all shapes, sizes and colors)
- Sharpie pens
- Large monitor / TV screens
- Small computers to radiate dashboards (e.g. CI/CD monitors)
How To
- Consider the positioning of all information radiators and who will have line of sight
- Consider use of color coding across different information radiators (for example, same color stickies to represent features)
- Allow sufficient time to produce high quality information radiators that will inspire and drive interest
- Introduce the information radiator to all those who will use it (either in contributing to it and/or consuming information from it)
- Encourage continuous inspection and update to the information presented
Practices we use that result in information radiators which we use to visualise work include:
- Impact Mapping
- Event Storming
- Value Stream Mapping and Metric Based Process Mapping
- Target Outcomes
- Social Contact
- User Story Mapping
- Product Backlogs
- Sprint Boards
- Burndown and Burnup Charts
- Build Monitors
- CI/CD monitors
- Retrospectives
- Realtime Retrospective
- Team Sentiment
Look at Visualisation of Work
Links we love
Check out these great links which can help you dive a little deeper into running the Visualisation of Work practice with your team, customers or stakeholders.